
Global Seismogram Viewer
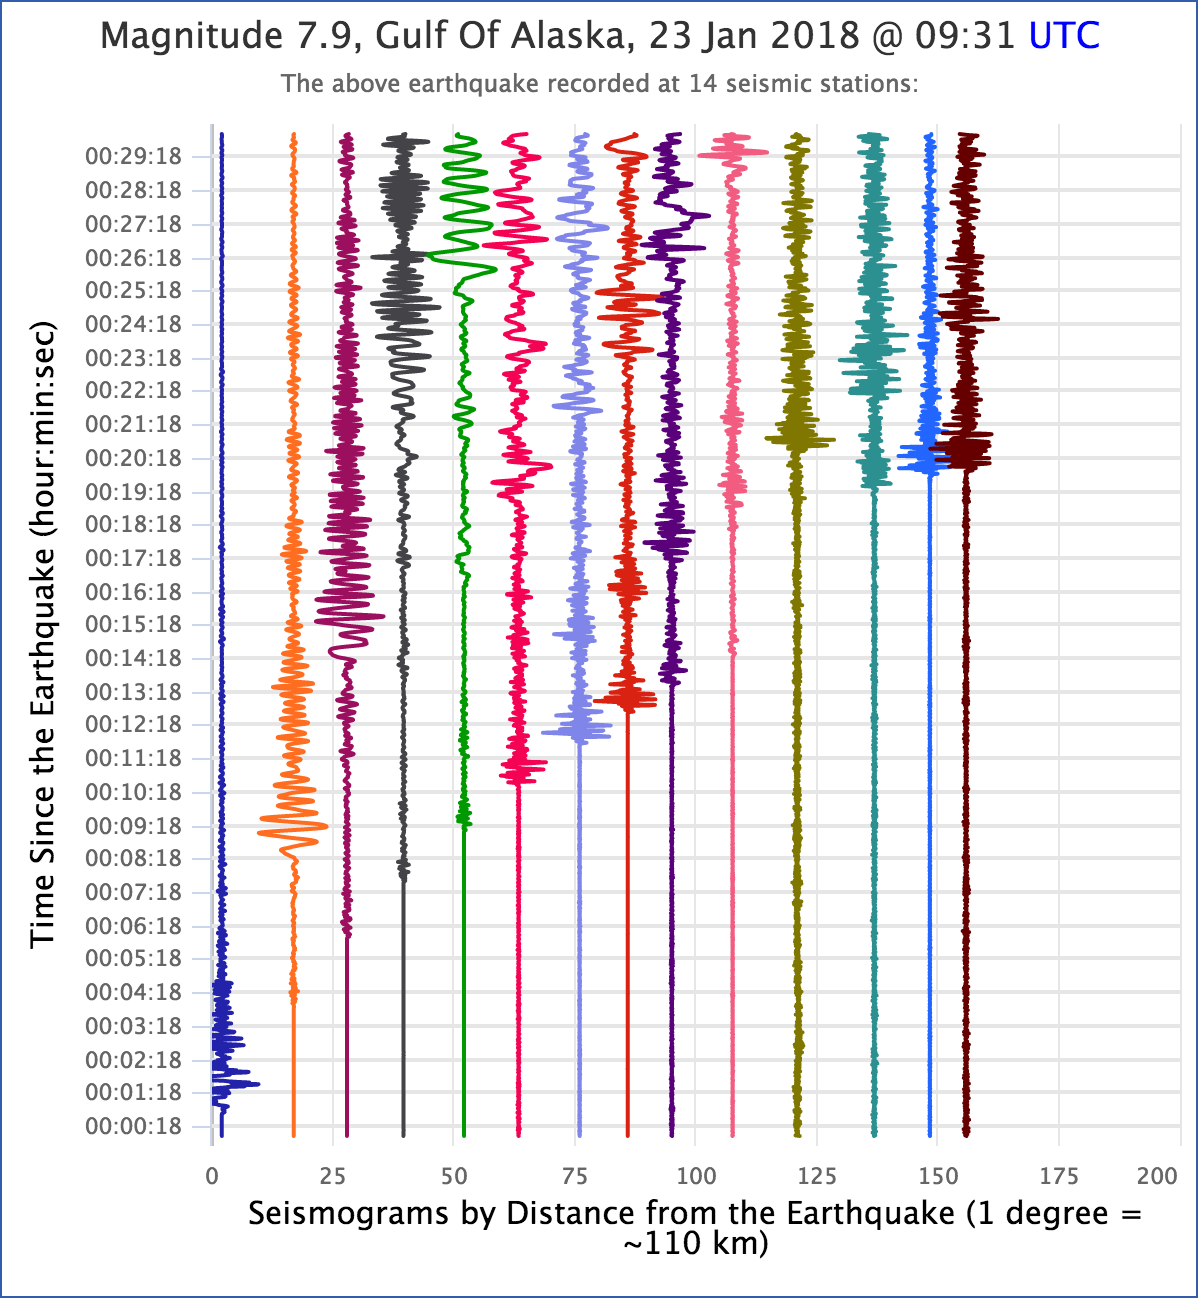
The Global Seismogram Viewer automatically creates clear plots of seismograms of large earthquakes from stations around the world, displayed by distance from the earthquake. The plots are tablet-friendly and can also be printed for use in a classroom without computers. The plots are designed to be appropriate for use with no parameters to set, but users can also modify the plots, such as including a recording station near a chosen location. A guided exercise is provided in the related resourrces tab (above), where students use the seismograms to discover the diameter of Earth’s outer core. Students can pick and compare phase arrival times onscreen which is key to performing the exercise. A companion station map shows station locations and further information and is linked to the seismogram plots.
Keypoints:
- Discover how Earth’s core was found and first measured
- Select a large recent or newsworthy earthquake, and optionally include a nearby recording station
- The resulting interactive plot allows students, via a classroom activity, to discover the P-wave Shadow Zone and how it can be used to determine the diameter of Earth’s outer core
- https://www.iris.edu/hq/inclass/software-web-app/global_seismogram_viewer
Keine Kommentare:
Kommentar veröffentlichen